
Be fearful when...
Valuations going into 2025 and the importance of entry valuations in investing.

Happy new year all! I hope each and every one of you will have a great 2025!
I have been researching about valuations recently, specifically looking at broad based index valuations and sector-wise valuations. November and December is usually the time when a lot of banks, fund houses, etc will come out with their yearly outlooks. There might be some overlap between reports, however, you might get a golden nugget as well. For folks, who don’t have access to a lot of data, I’ll be summing up some interesting bits and pieces I’ve seen over the past month in this valuations report.
The important inferences aren’t with regard to economic or corporate events. They involve investor psychology. It’s not a matter of what’s happening in the macro world; it’s how people view the developments. When few people think there can improvement, security prices by definition don’t incorporate much optimism. But when everyone believes things can only get better forever, it can be hard to find anything that’s reasonably priced.
Howard Marks, ‘On Bubble Watch’
Recap 2024.
Risk assets had another strong year in 2024. Robust performance in the US drove developed market equities to a total return of 19.2%, while emerging market equities saw an 8.1% gain, fueled by a late rally in Chinese equities and solid results from India and Taiwan. US mega-cap tech continued to lead global growth stocks for the second consecutive year, but prospects of deregulation after the US elections also bolstered financials, with global value stocks climbing 12.3%. Commodities were restrained by sluggish demand in China, resulting in a 5.4% return for the broad commodity index, though gold outperformed with an impressive 27.1% return amid concerns over US fiscal policy. Central banks in developed markets began policy normalization in 2024, but resilient economic growth and persistent inflation led markets to scale back expectations for swift rate cuts, especially in the US. The strengthening dollar and rising yields weighed on global investment-grade bonds, which ended the year with a -1.7% return.
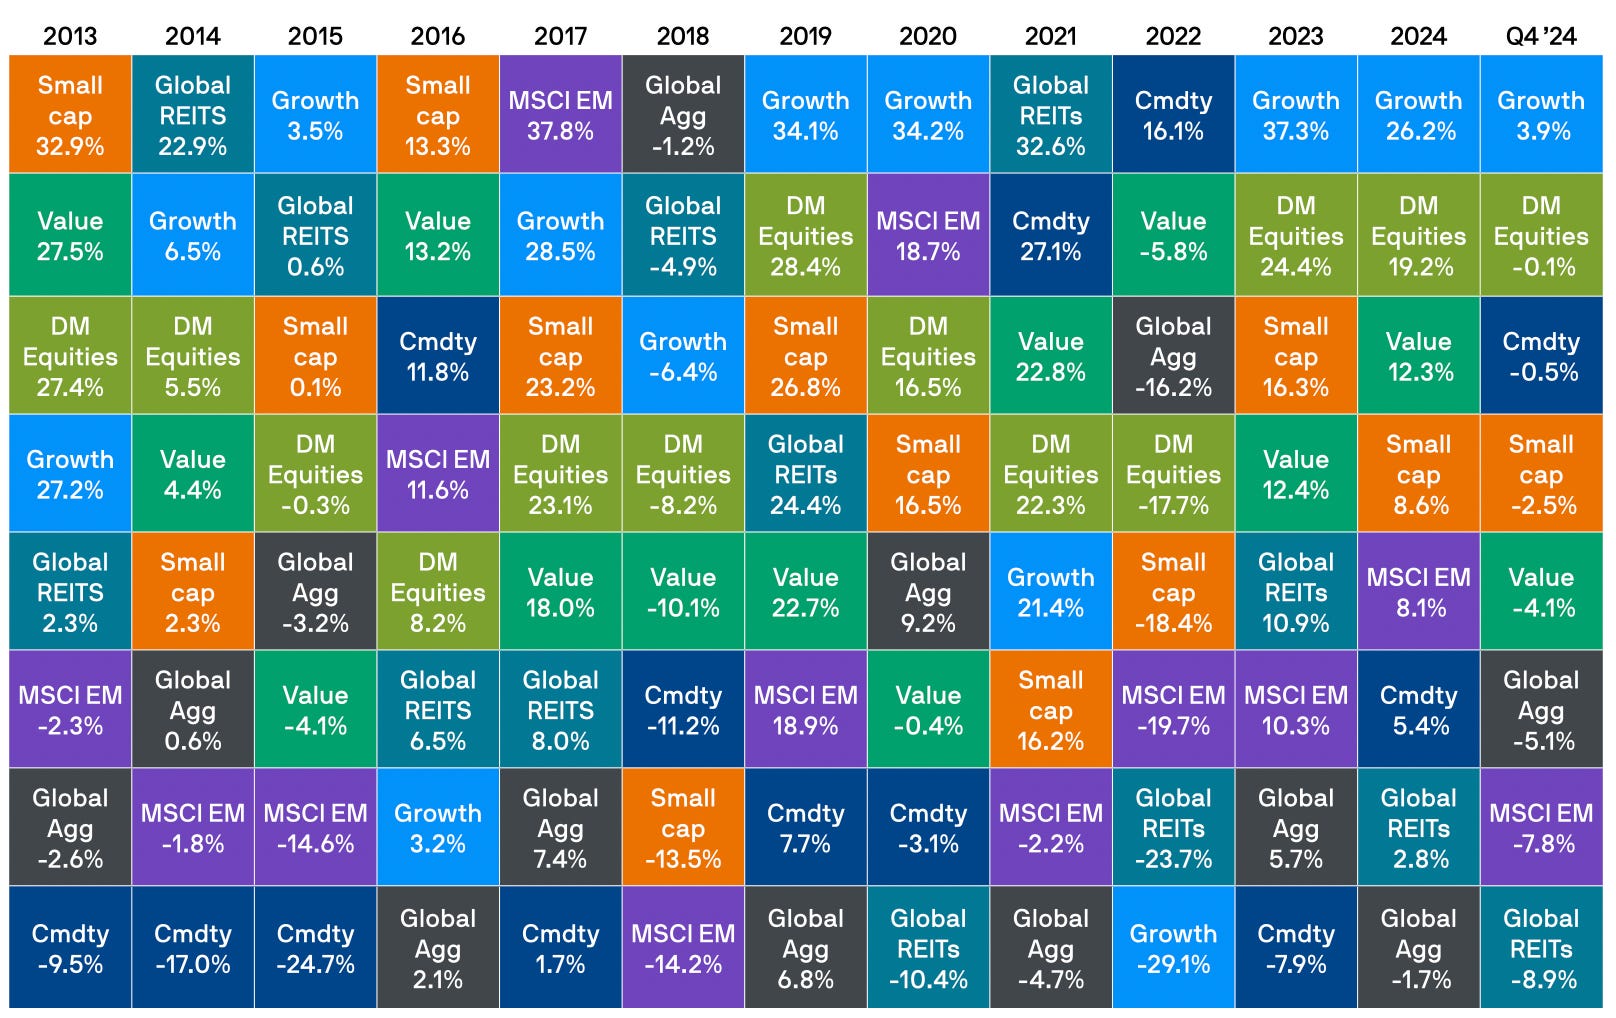
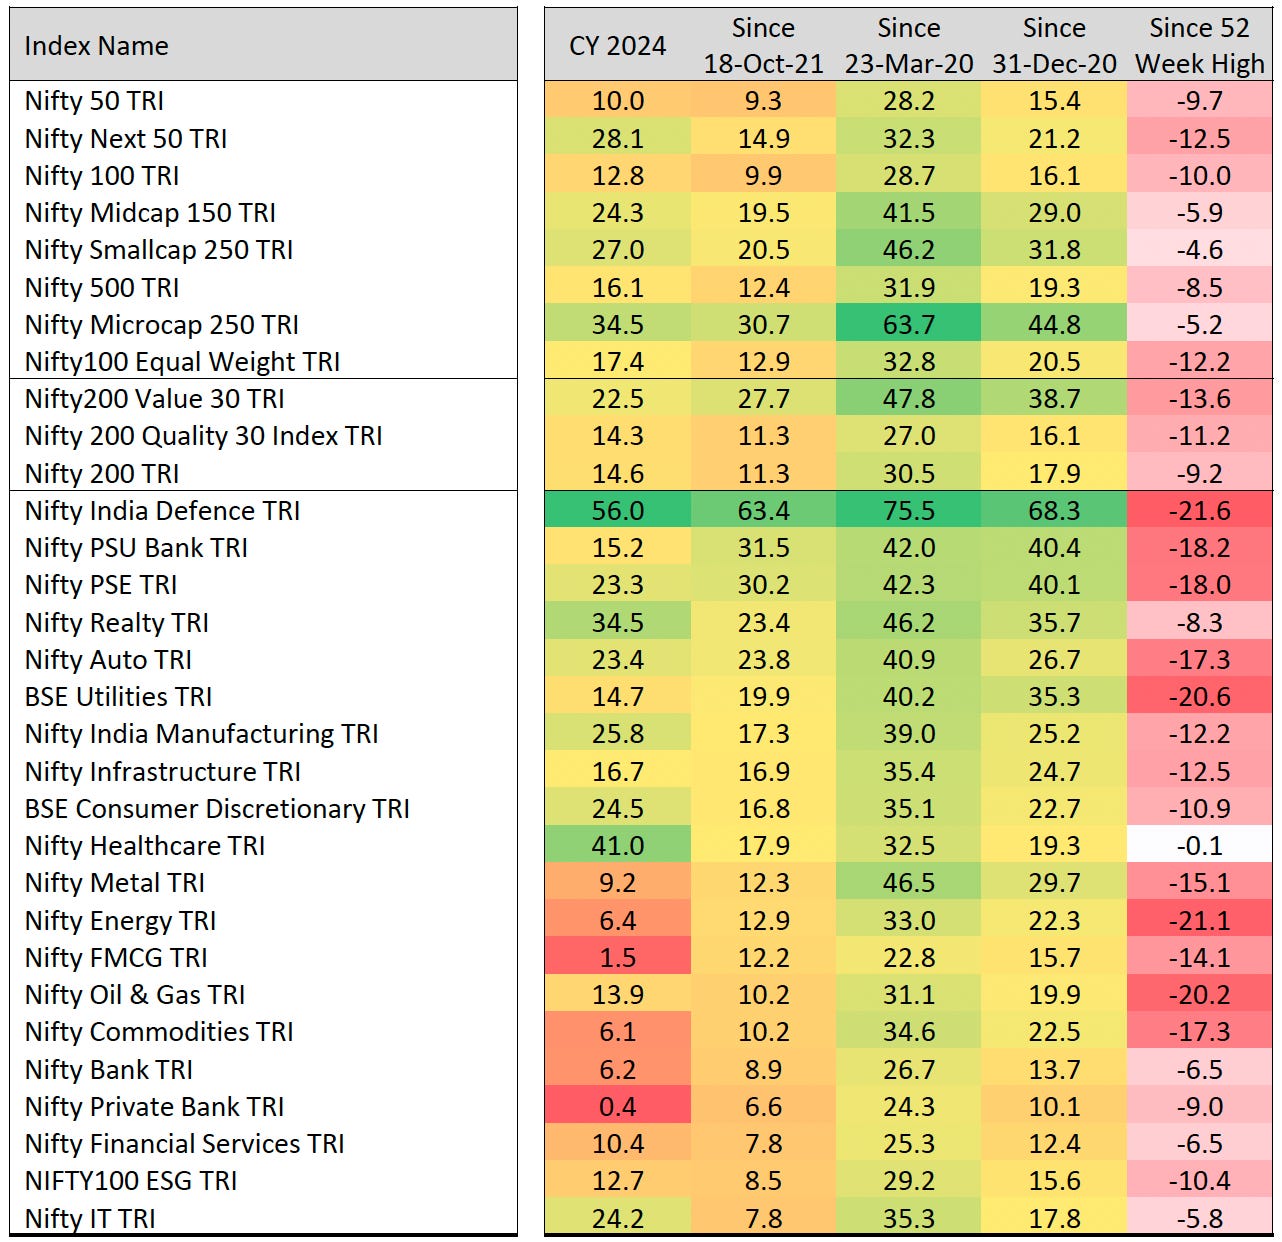
Indian markets are ending 2024 in the green. This is the 9th consecutive year of gains for Indian equities. Nifty 50 ended with modest 10% gains, another year of stellar performance for mid caps, small caps and micro caps.
On the earnings front, there is a visible slowdown going into the third quarter for the year.
Valuations going into 2025.
In terms of valuation, this how things stand as of 7th January 2025 market close. We will compare sectors and broad based indices on simple fundamental measures such as Price to Earnings, Price to Book and Dividend Yield.
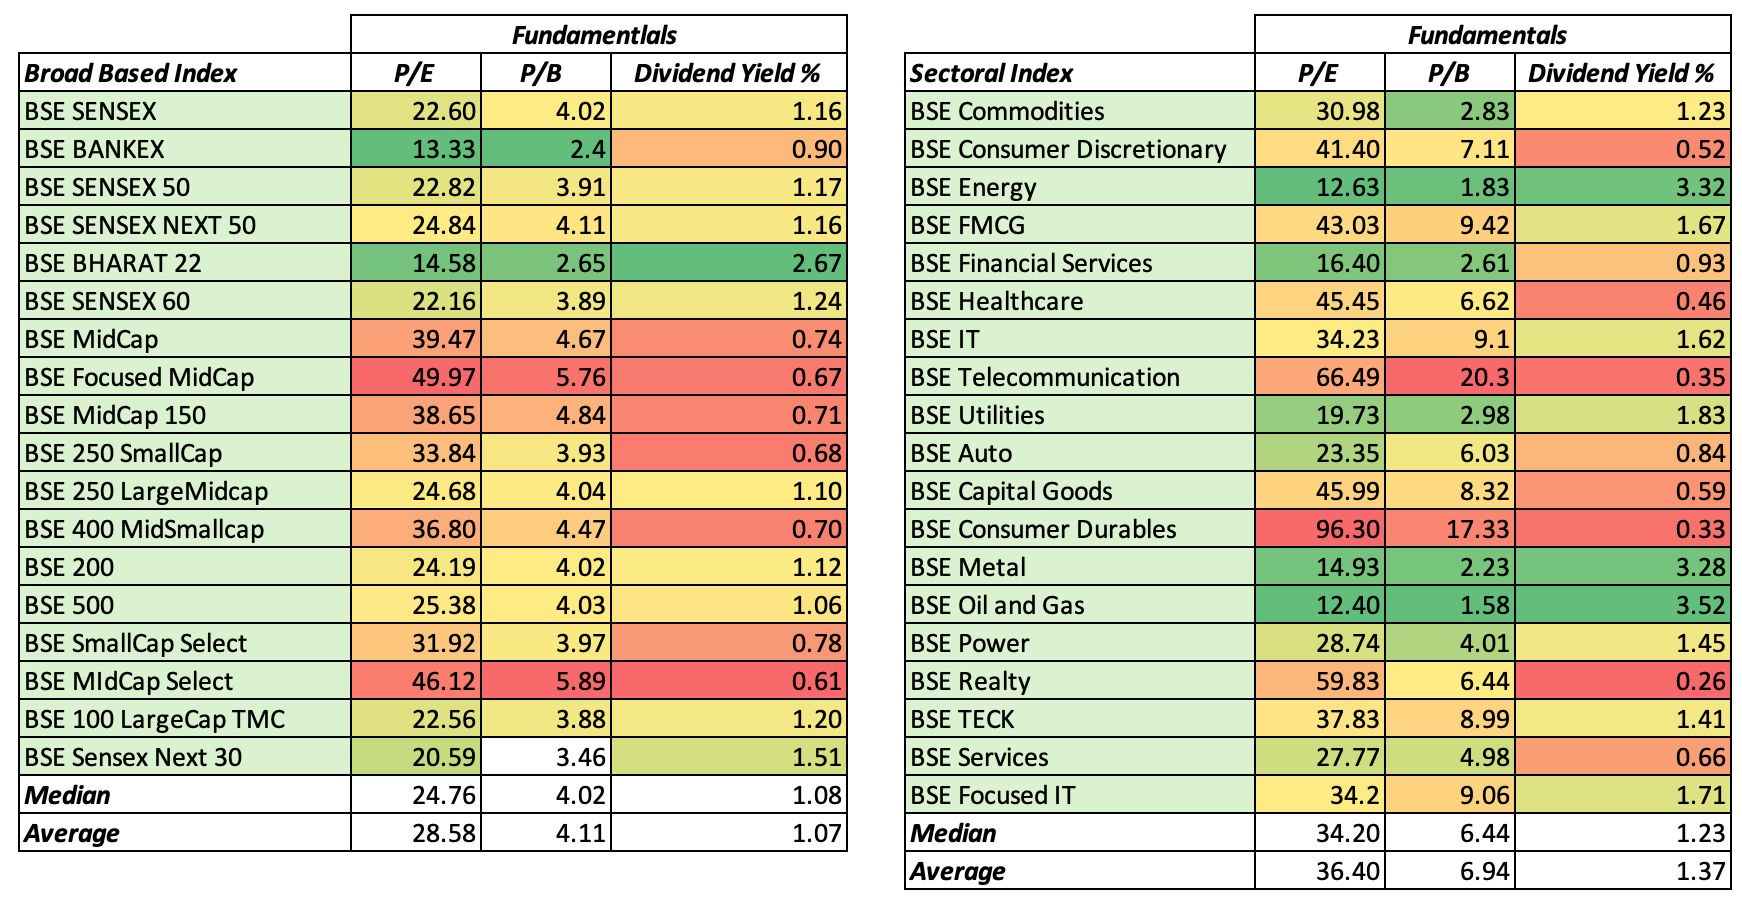
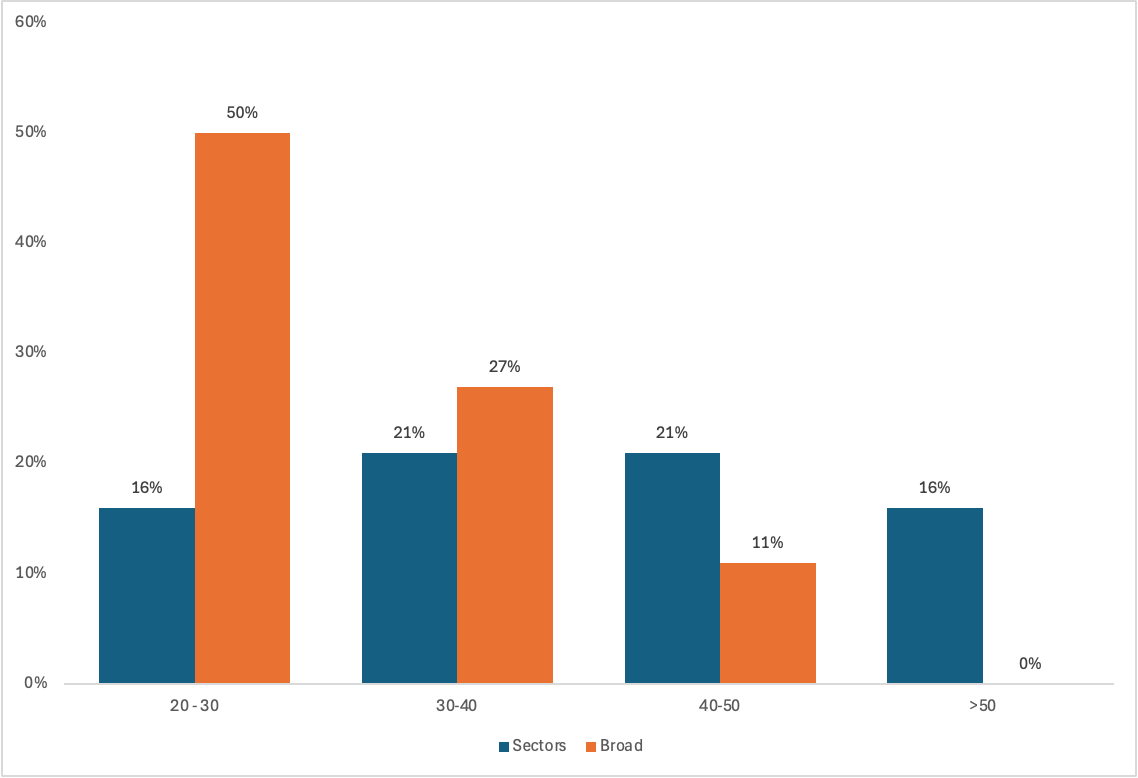
From this data the evidence clearly shows that markets have become expensive. The broad based indexes are not reflective of the current situations. The median P/E for broad based indexes is 24.76, while sectoral indexes is much more elevated at 34.2x. A whopping 58% of sectoral indexes are currently trading above 30x earnings (notice telcos and consumer durables trading at 20x and 17x their book values).
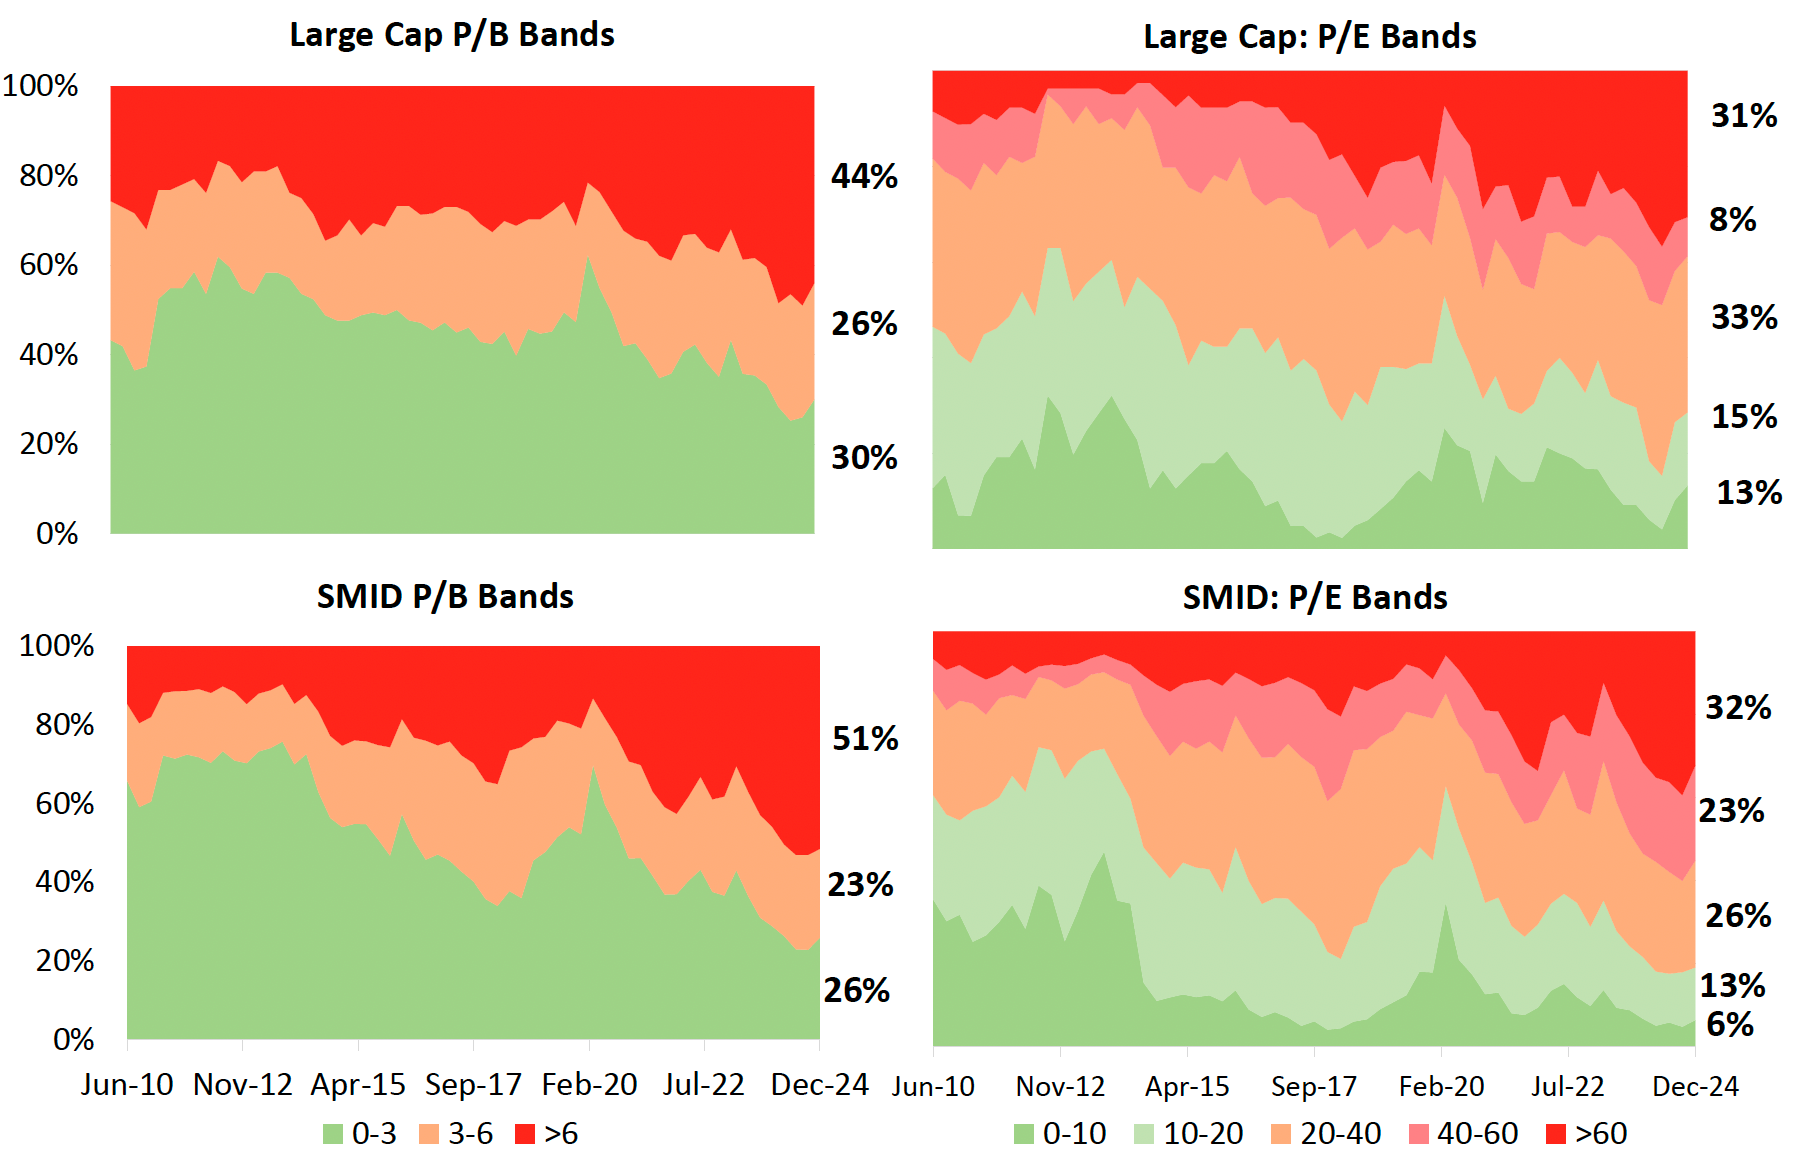
In the NSE 500, the percentage of stocks trading below three times their book value has fallen sharply, from 70% during the COVID period to just 27% now. This is well below the historical average of 44%, which had previously presented attractive opportunities for investing in SMID stocks. The number of companies trading below 3 times their book value is near its all-time lows. However, with valuations now elevated, a more cautious approach is recommended at this point in the cycle.
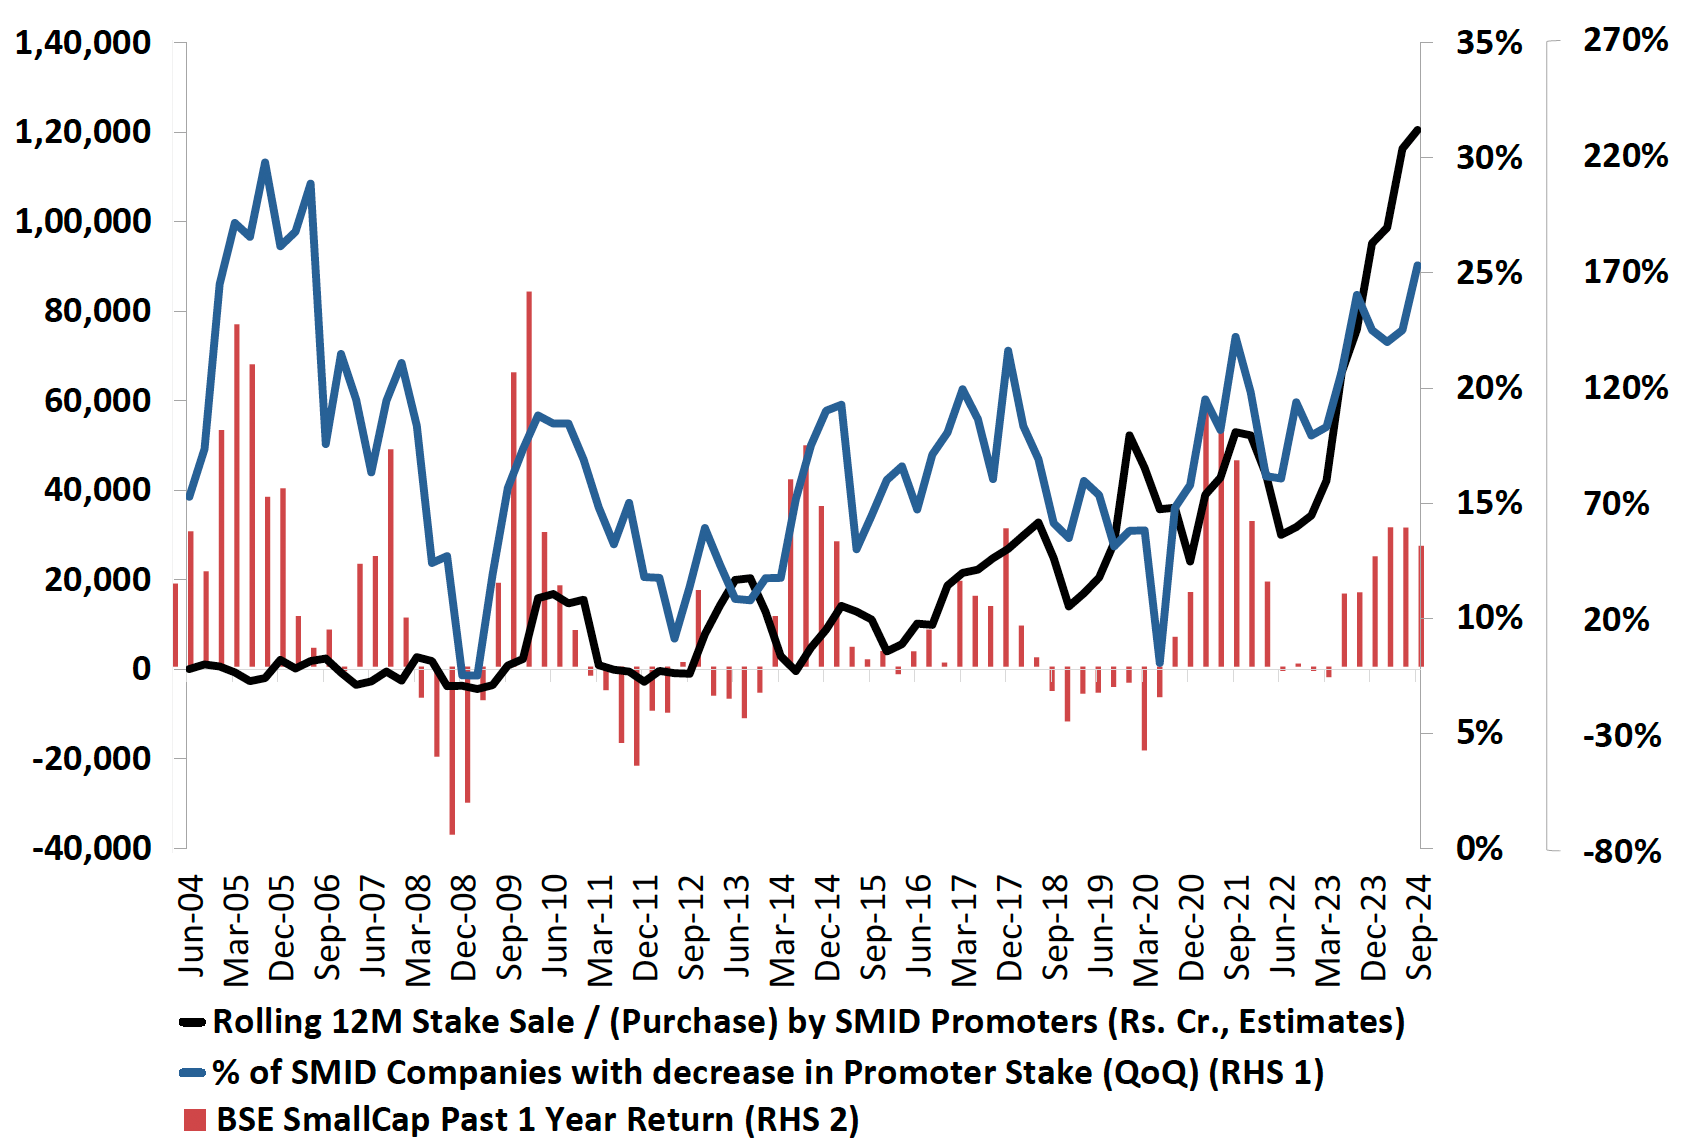
This coupled with increased selling of stakes by promoters, especially in the SMID segment doesn’t bode well for these segments. The SMID universe is currently trading at nearly 40 times its trailing price-to-earnings multiple, while aggregate earnings growth is slowing to low double digits. Additionally, one in four small and midcap company promoters have been net sellers of their equity stakes. This trend has accelerated significantly over the past two years, coinciding with the rally in SMID stocks. Over the last 12 months alone, promoter selling in this segment is estimated to have reached ₹1.2 lakh crores.
Index and sectoral valuations are just a starting point, it’s not something we can look and jump to conclusions. One needs to be aware of the dynamics, numbers (historical earnings growth and expectations) and the narrative around the sector. It is then you can look at the complete picture, valuations is just one side of the story.
There is an important caveat, looking just at valuations will not give you a complete picture. Indian equities trade at a premium relative to benchmarks globally, and this the premium will continue to exist as long as Indian equities exhibit their superior quality.
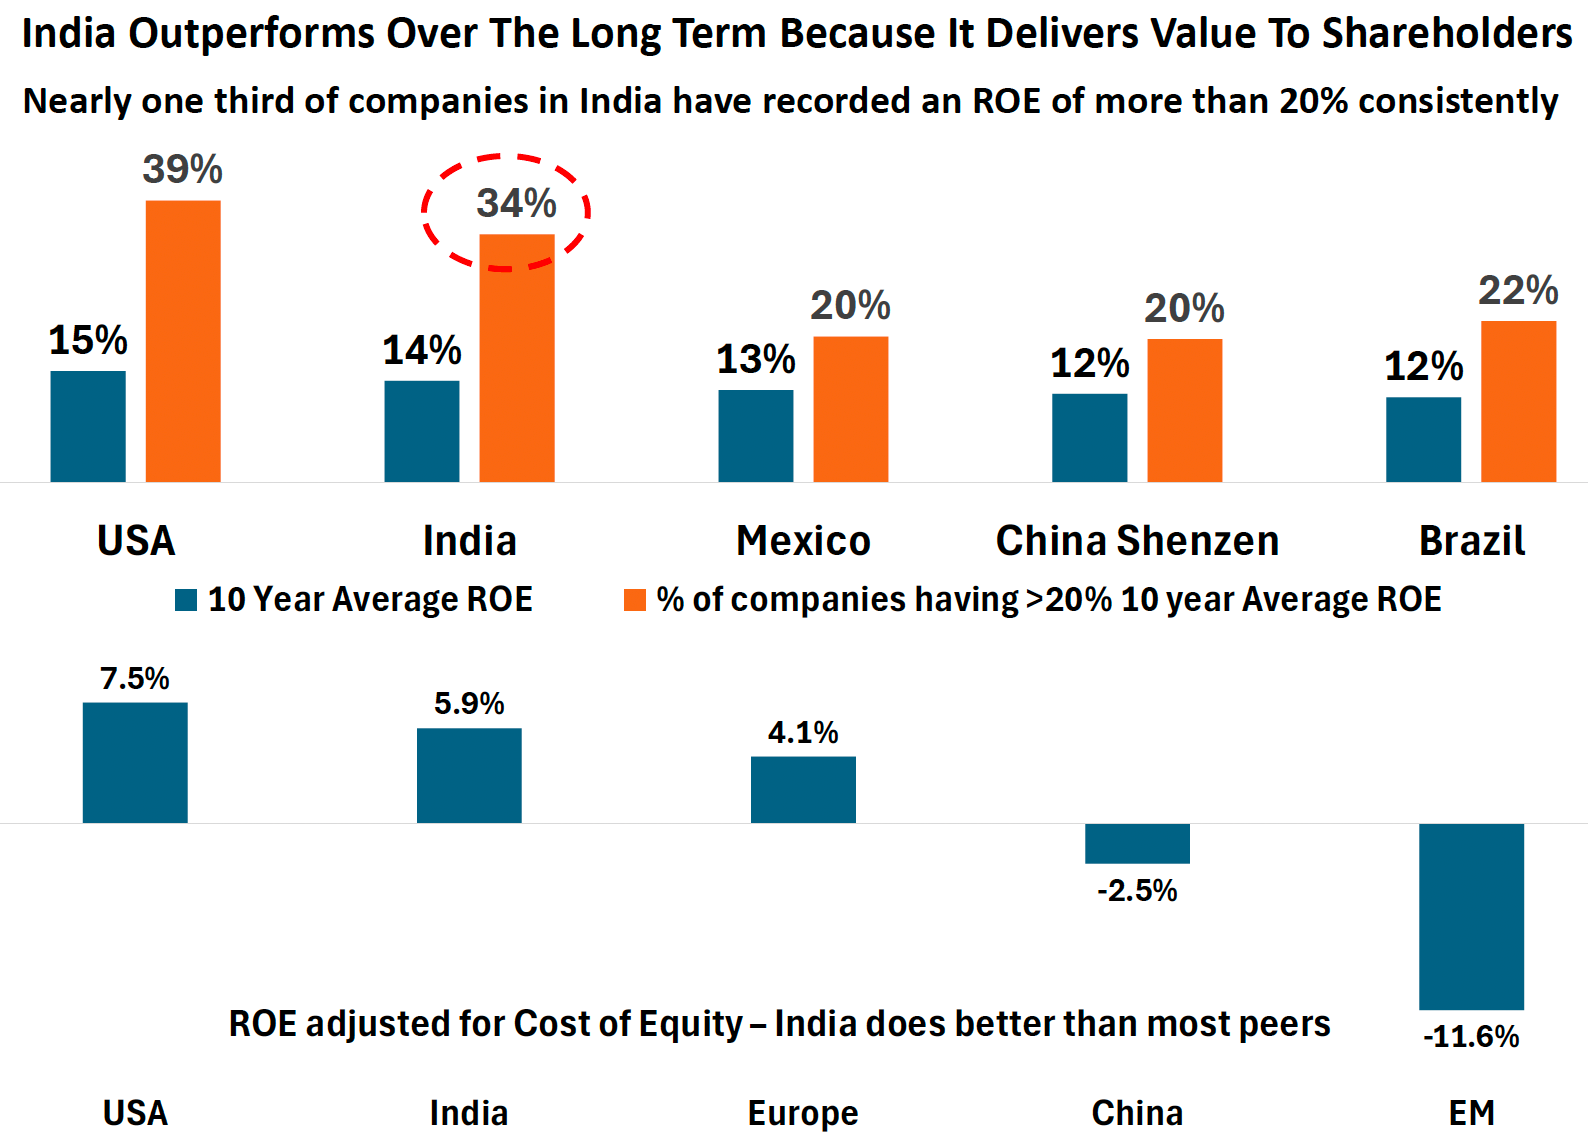
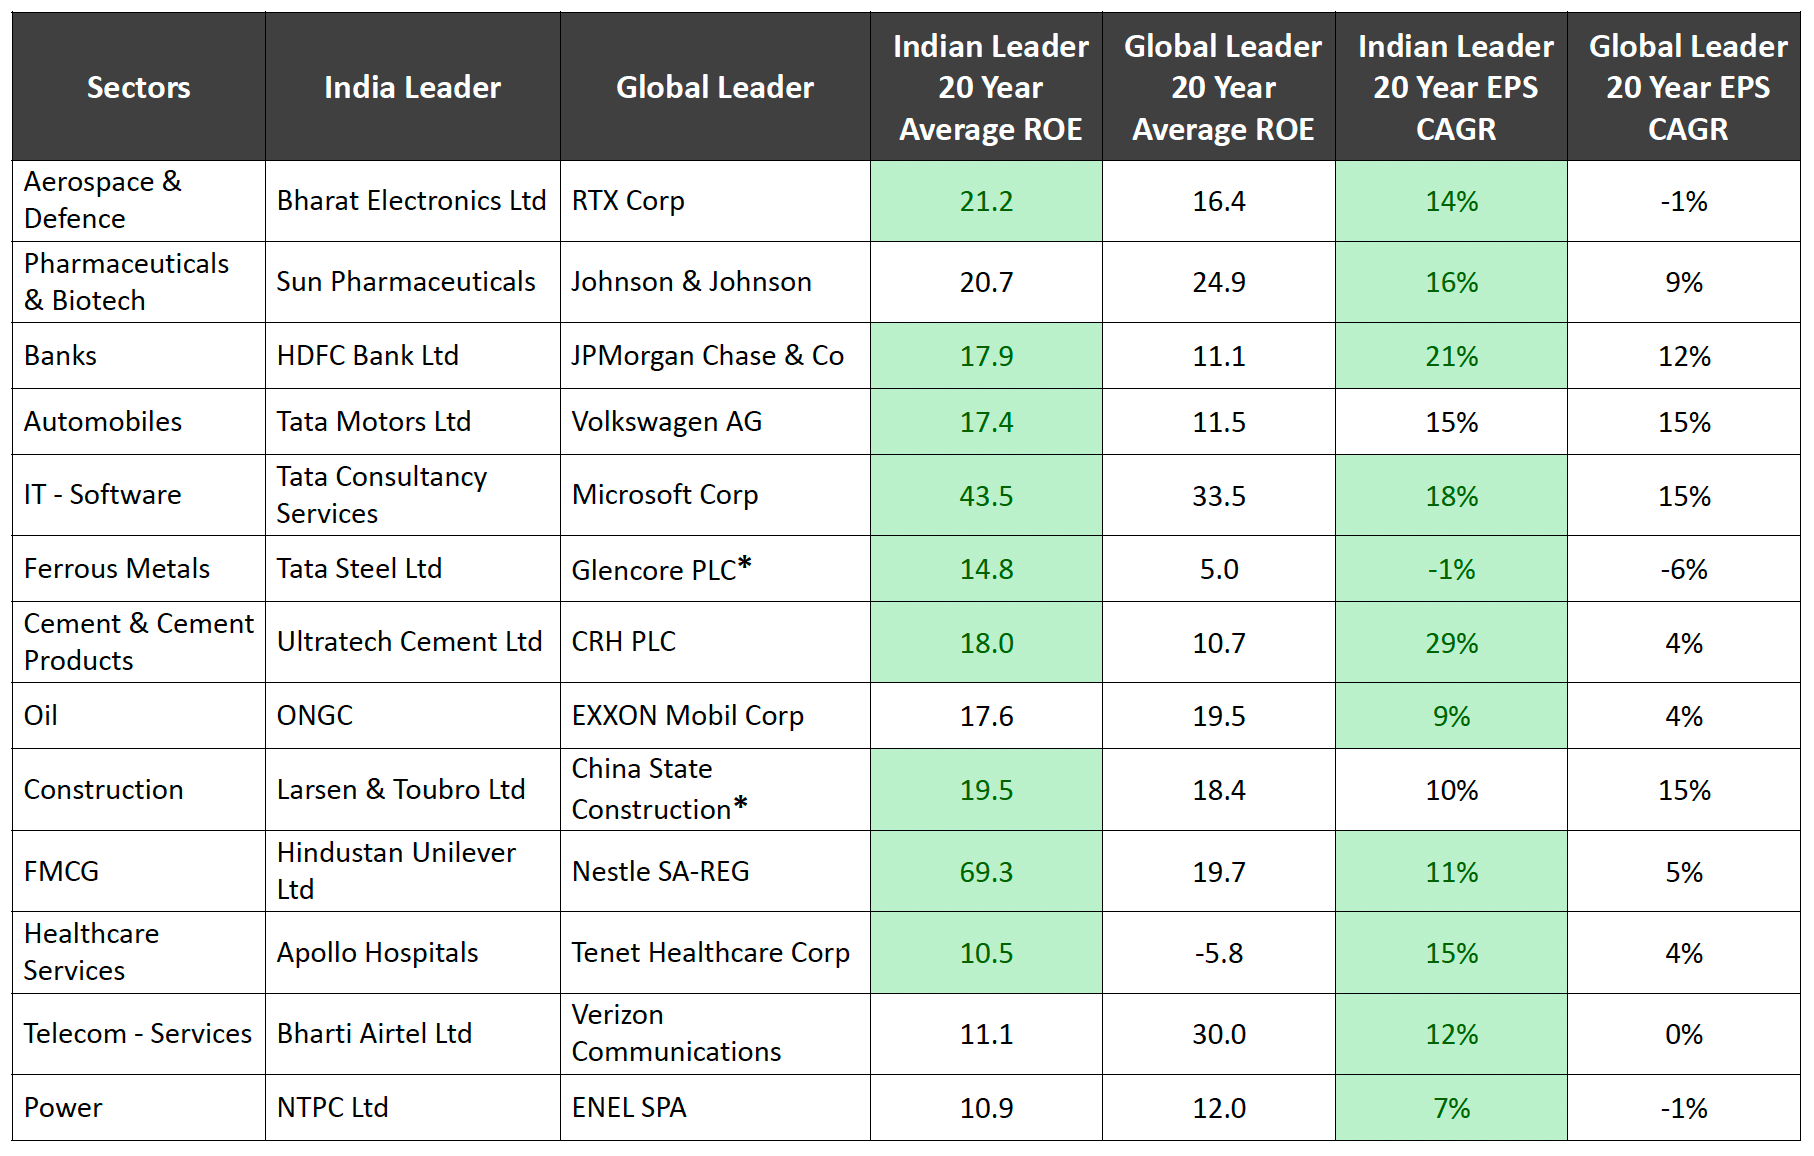
India’s long-term stock market outperformance is often credited to factors like domestic fund flows or high GDP growth, but these are superficial explanations, there is not a lot of evidence when it comes to the correlation between GDP growth and equities growth. The core question is why stock investors should expect higher returns compared to bonds. The additional returns from equities arise from a company’s ability to generate returns that exceed its cost of capital. Consequently, the key driver of stock prices over the long term is the return shareholders earn on their capital. Companies with higher return on equity (ROE) are more likely to outperform their peers. This is evident most of the sectors as well. Autos globally are infamous for having low return on equities, Indian automobiles have consistently delivered over and above their cost of capital.
When adjusted for differences in the cost of capital, India outshines most other markets. It ranks second only to the U.S. in the number of companies consistently achieving an ROE of over 20% for more than a decade. This consistent strength in ROE is the real force behind India’s superior stock market performance, underscoring that robust fundamentals—not popular narratives—are what truly drive long-term success.
Now, this forms a complete picture.
Historical references.
The only constant is change. That is especially true when it comes to investing. Winners rotate, sectors rotate, last couple years were for SMID stocks, massive wealth has been created for people who were positioned correctly during this up-cycle. As of December 31, let’s look at where SMID stocks stand in terms of large caps.
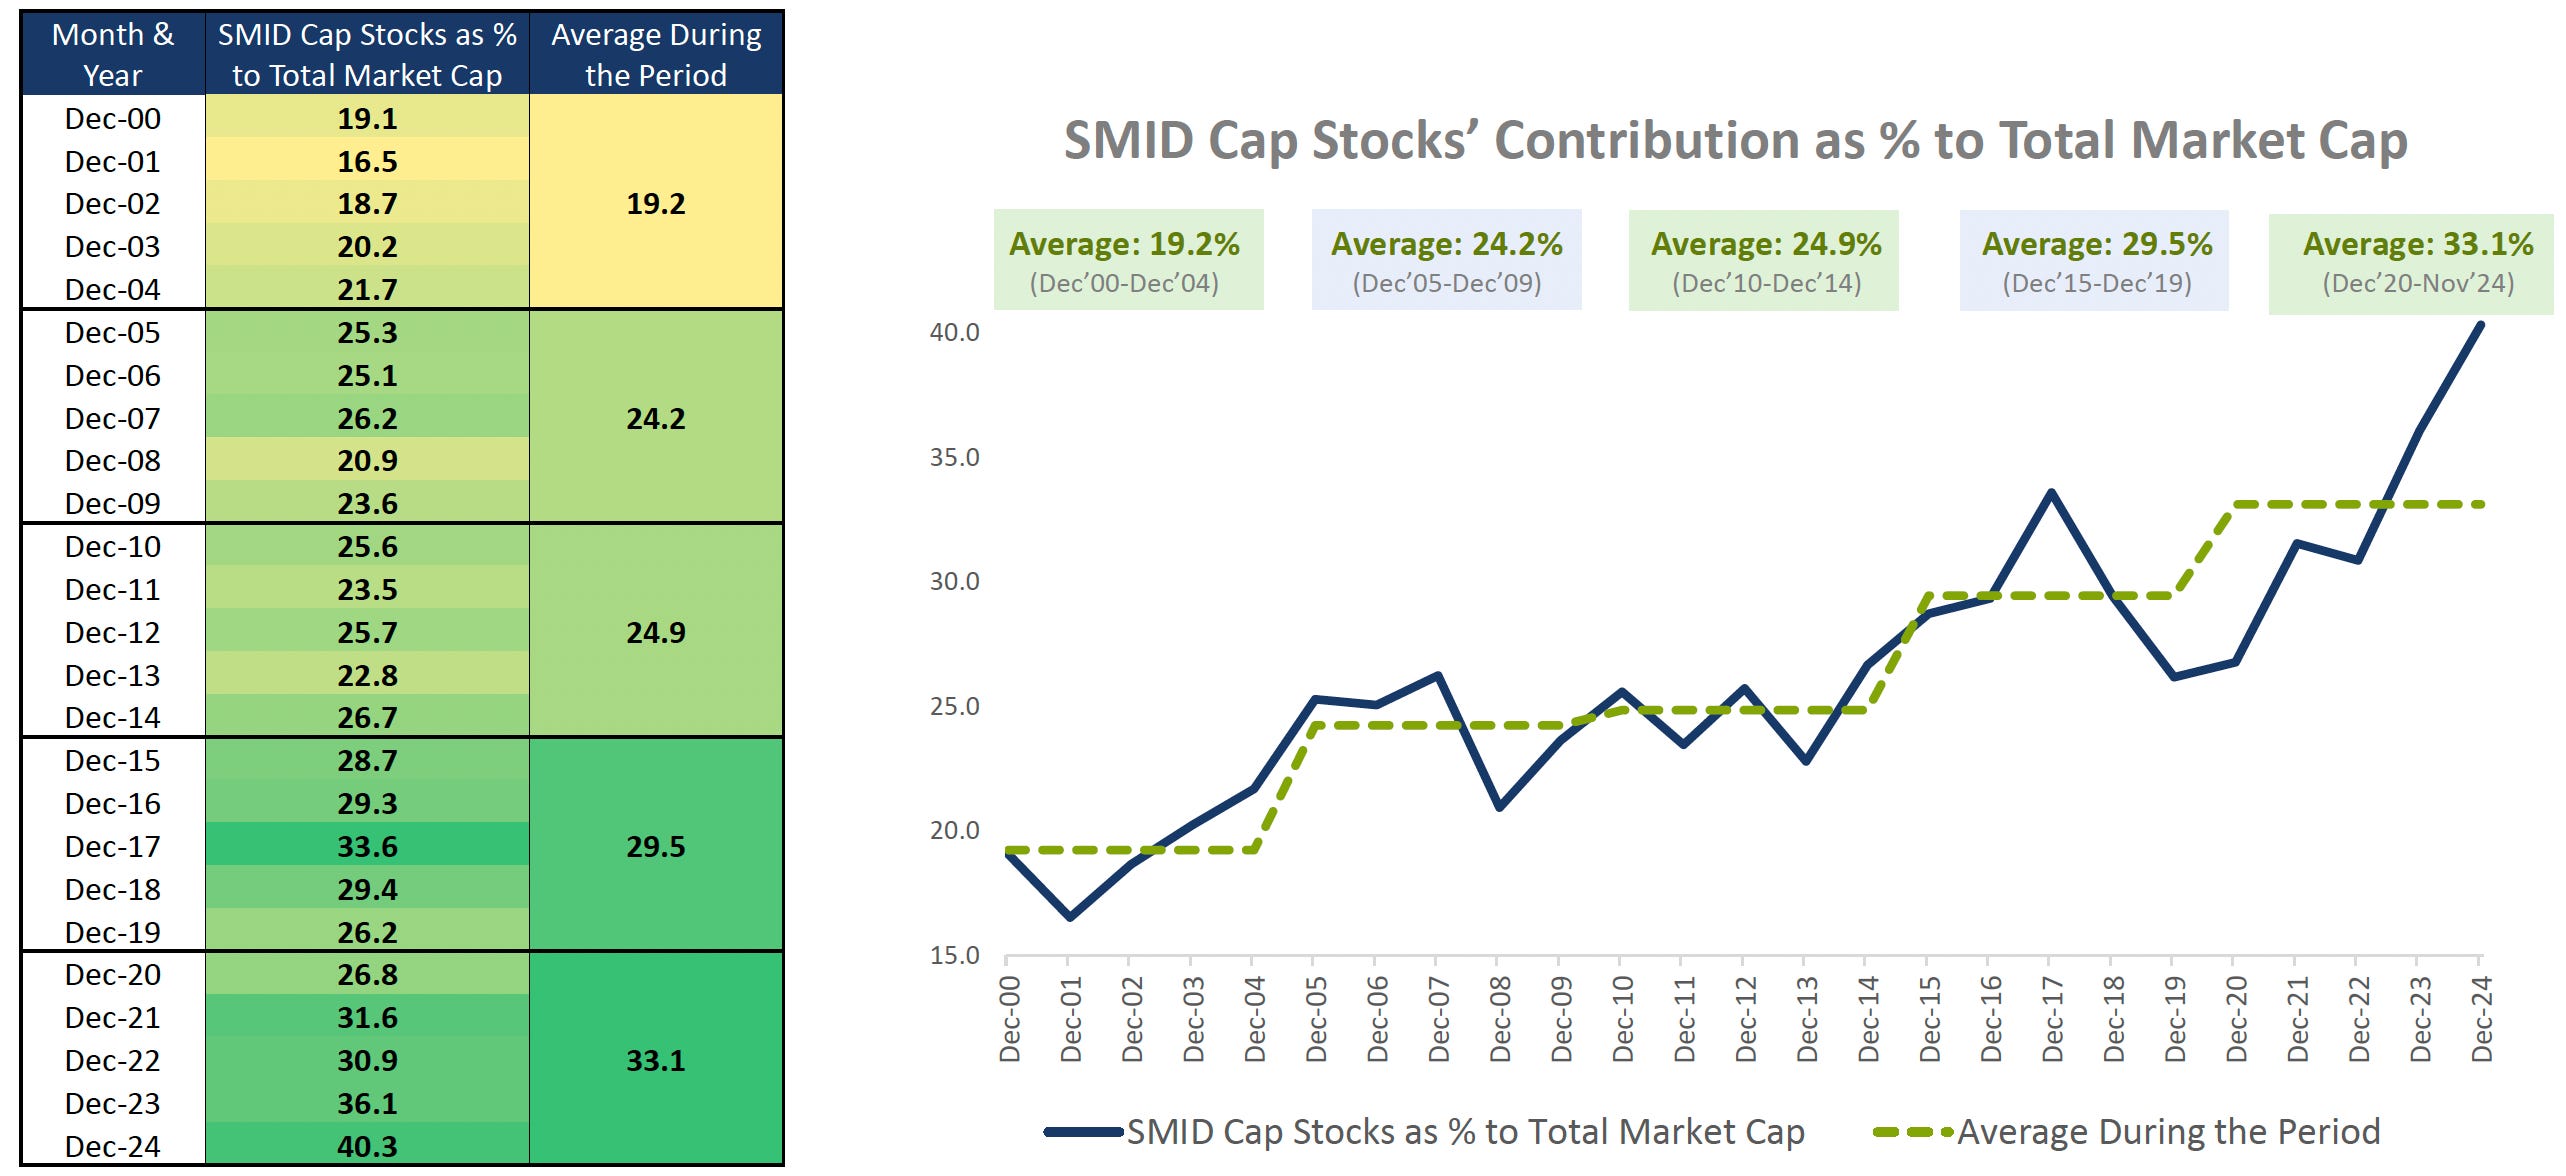
SMID equities as a % of market cap has been steadily increasing since December 2000. As of December 2024, the figure stands at 40.3%, and the average for the period between Dec-20 to Dec-24 stands at 33.1%. This shows the secular nature of the bull run in Indian equities.
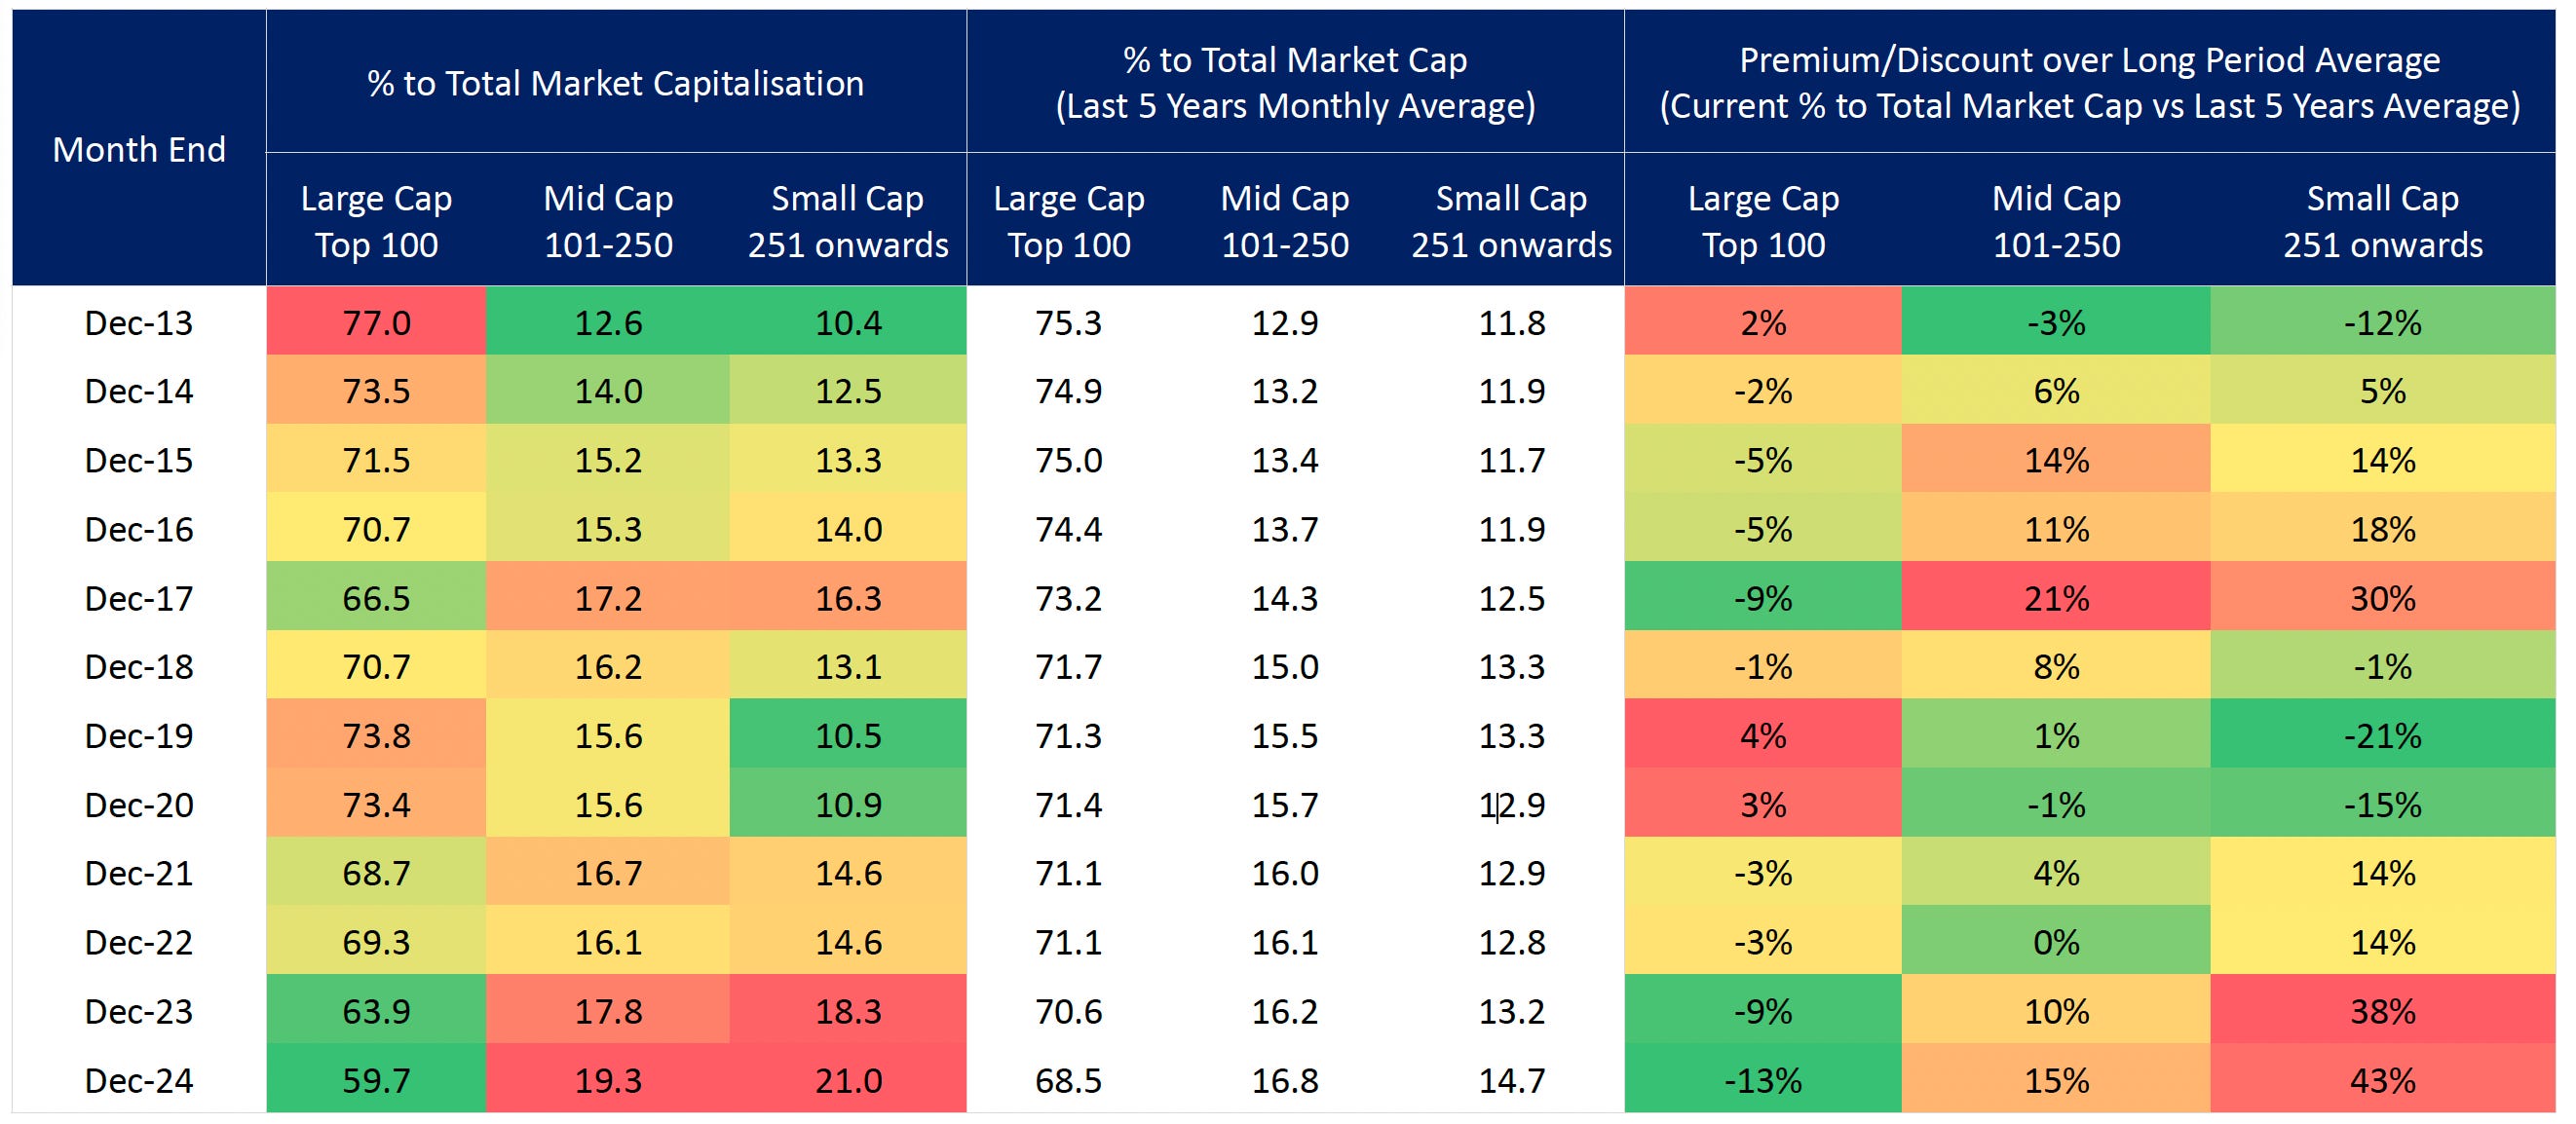
Over the years, the composition of market capitalization across large-cap, mid-cap, and small-cap segments has undergone notable shifts. Large caps, which accounted for 77% of the total market cap in December 2013, have steadily declined to 59.7% as of December 2024—significantly below their five-year average of 68.5%. In contrast, mid-caps and small caps have increased their market share, with small caps rising sharply to 21%, well above their long-term average of 16.8%.
This trend is further emphasized in the premium/discount analysis, which reveals that small caps are trading at a +43% premium to their historical averages, reflecting heightened investor enthusiasm or potential overvaluation. On the other hand, large caps are at a 13% discount, suggesting subdued investor sentiment or attractive opportunities for value investors. Mid-caps remain relatively balanced with a modest 15% premium, indicating steady interest. This shift highlights a dynamic market landscape where investors increasingly gravitate toward mid and small-cap opportunities, while large caps are potentially undervalued in the current environment.
Weak Growth
India has been slowing down. There has been a significant slowdown in retail lending, especially in the unsecured personal loans. RBI has kept the monetary conditions tight, on 27th January, RBI announced a strategy to tackle the liquidity crunch. According to estimates, this will be close to INR 1.5 trillion, in terms of cuts in CRR (Cash Reserve Ratio) and OMO (Open Market Transaction) in the tranches of Rs 20,000 crore each on January 30, February 13, and February 20 (total 60k cr).
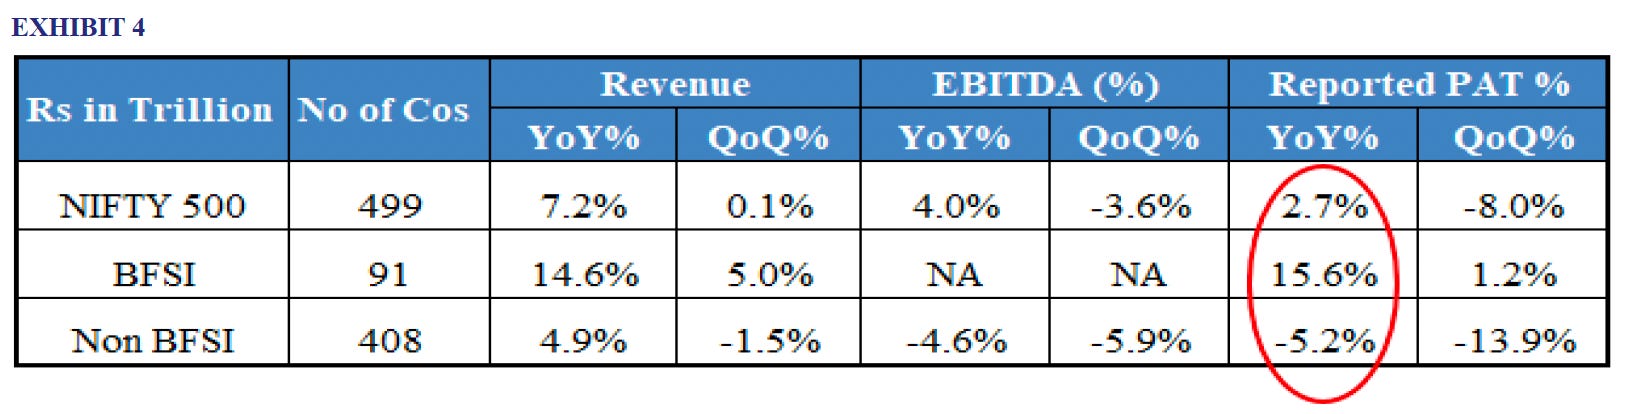
Earnings growth has also slowed down. Not only EPS growth is slowing down, but estimate trajectory is also normalizing with downgrades in the broader market. Broader consensus is still quite bullish on earnings for FY26 with a 14-15% increase. My base case would be around 8-10% growth, it could even be lower, in the mid to high single digits.
In the face of all this, valuations have certainly cooled off, especially in the large segment. Currently, Nifty EPS stands at INR 1,094. Assuming an modest 8% growth in EPS, it would be 1,181.52, this would translate to a forward multiple of about 19x, which for is a reasonable multiple to pay for owning high-quality names in my portfolio. I definitely see value in a lot of large cap names, this correction is welcome with open arms.